geo1007-labinstructions
GEO1007 Lab 7 - SensorThings API
Begin by synchronizing your fork. This assignment consists of three parts:
Part A - Installation of the FROST Server
Part B - Pushing and querying real-life sensor data to your database using FROST
Part C - Visualizing sensor/s in geospace using Leaflet and STA-Map
Part A - Installation of the FROST Server
The FROST server is an open source server which implements the OGC SensorThings API. Just as with GeoServer installed in earlier labs, we’ll be implementing the FROST server within the Tomcat server.
Go ahead and set up the server following the guidelines here, and return back to these instructions.
Once installed and tested, make sure you’ve launched your Apache Tomcat server
and navigate back to the FROST server:
http://localhost:8080/FROST-Server.HTTP-2.3.1.
You will see a simple HTTP tool, pre-filled with some JSON. Don’t change
anything and open your developer tools. Now change the HTTP method from GET to
POST and click execute, monitoring the network traffic. Switch back to
GET, still monitoring network traffic, and again click execute. You should
see a log containing the Thing you just created. Finally, figure out how delete the
Thing (or Things) you just created.
❓ Question #1
- How was the data posted and fetched via the API, i.e. what HTTP requests are being made and what is their formulation?
- How do the requests URLs differ from the (hint: relatively long) request URLs we saw in earlier labs with, for example, WFS?
- Which table was populated in your database and why? Provide a screenshot of the newly published data (from your database).
One of the nice things about using an API as opposed to posting via a URL is that we receive more verbose error codes when things go wrong (which as we know by now often do).
❓ Question #2
FROST has implemented a specific database schema (Figure 1 below) which is strictly enforced by the API. Lets try break the rules and see what happens.
Let’s generate a
400error using the in-built HTTP tool. Switch back toPOST, add an extra field to the payload and see what happens. Feel free to get creative with other errors too.
- Describe what the error means within the context of the SensorThings Database schema (i.e., why is your post invalid?)
- Take a screenshot of the response you received
Part B - Pushing and querying real-life sensor data
It is time to start populating our database with readings. Before doing that, you should familiarize yourself with the data model defined by the SensorThings API standard. This model consists of the following objects:
Thing,Location,Observed PropertySensorDatastreamObservationHistorical LocationFeature of Interest
The UML diagram below shows the relationship between the various objects, as well as the fields that each object can accept.
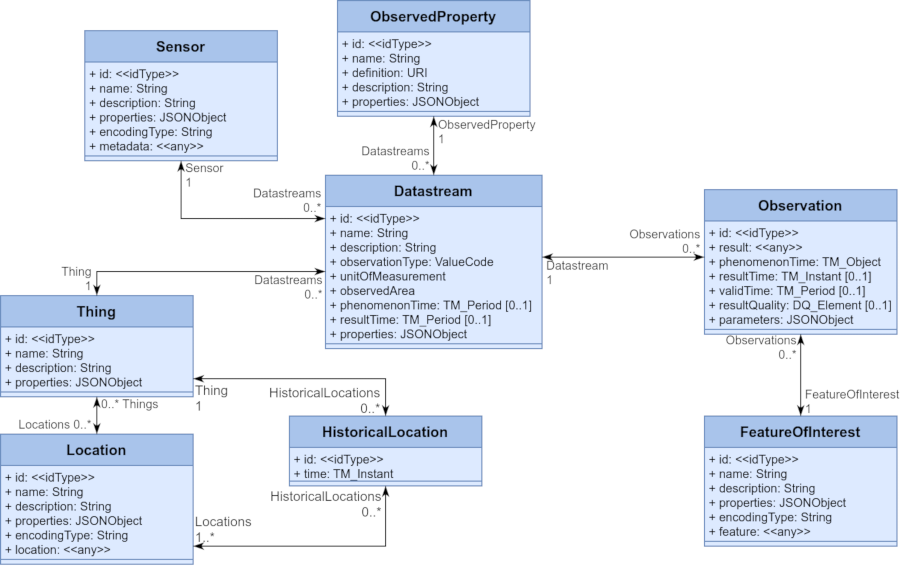
Figure 1
Get a JSON parser plug-in for your browser
In case the standard web developer tools do not contain the functionality to pretty-print JSON files (e.g. Firefox has built-in support), it will be useful to have a plug-in in your browser to parse JSONs and make them more human readable, (e.g., Chrome).
Unpack the Parking Data
The data we’ll be using was scraped from the TU Delft parking website.
In the data/lab7 directory you’ll find a zip containing two CSV files. For this
first part we’ll be
using the smaller sample set parking_available_sample.csv. Make sure the
files are in the /data/lab7 directory and not embedded in another directory
(e.g. /data/lab7/lab7)
Create Things
Inspect the CSV. The information in each row is in the
following format: Date Time UTC;Car Park;Parking Spaces Available. Use the HTTP
tool, the UML diagram and the pre-filled example to create the correct number
(for you to figure out) of Things (hint: if you refresh the FROST page, the
default JSON in the HTTP tool will come back).
If you successfully created your Things you should receive a confirmation code
(otherwise an error).
Similar to the getCapabilities we saw with WFS etc., you can find out more
information about the API’s capabilities. The link to this will be at: http://localhost:8080/FROST-Server.HTTP-2.3.1/v1.1.
❓ Question / Result #3
- Answer in your own words why you think that a
Thingdoes not have location information directly embedded in it, even if what we’ve created (a car park) is quite immobile.- Save a screenshot of the filled in HTTP tool with your compiled JSON object used to create entities in the report
- Use the API on your browser to access the full set of created things and save the JSON output, attach it to the report
Create Locations
Now we will create the Locations and associate them with the Things you just
created. In the HTTP tool, you’ll now have to change the API endpoint (hint,
before we were using v1.1/Things and you can see which other endpoints are
available from the v1.1 link.).
Refer once again to the data model to see how to compose your POST request, which should look something like this:
{
  "name": "<name>",
  "description": "<description>",
  "properties": {},
  "encodingType": "<encodingType>",
  "location": {
    "type": "<geometryType>",
    "coordinates": [<longitude>, <latitude>]
  },
  "Things": [
    { "@iot.id": <id of Thing>}
  ]
}
Take also note of the following:
- for the
encodingTypefields, use"application/geo+json"(remember, this is a MIME type as discussed in lecture 1), - for the
locationuse the following:{ "type": "Point", "coordinates": [<longitude>, <latitude>] } - The
longitudeandlatitudein a decimal format can be obtained from Google Maps by right clicking on the location (hint: the parking website has links to the location of the carparks.) Note: Google Maps gives you LATitude / LONGitude, so make sure to invert the numbers you get. - Its for you to decide what the correct
<id of Thing>to use in the above request (hint: it should be anint, and you can view theThingsyou created at http://localhost:8080/FROST-Server.HTTP-2.3.1/v1.1/Things)
❓ Question \ Result #4
- What role does the
@iot.idfield in the above POST request serve?- The
Thingsfield is an array of key-value pairs. What do you think this means in this this context, i.e. why is it not just one key-value pair.- Save a screenshot of the filled in HTTP tool with your compiled JSON object used to create entities in the report
- Use the API to access the full set of created
Locationsand save the JSON output, attach it to the report
Create ObservedProperty
Similar to before, change the API end-point and create just the one
ObservedProperty entity by posting:
{
  "name": "Parking Spaces",
  "description": "Number of free parking spaces",
  "properties": {},
  "definition": "Free CAR parking spaces (i.e. a car is not parked there and you can park.)"
}
Create the Sensors
We do not have much insights about the type of Sensors used at the carpark, so the information we can pass is sparse.
Again change the API endpoint, and create just the one Sensor that we’ll
use throughout by posting:
{
  "name": "Some Parking Sensor",
  "description": "Generic placeholder parking sensor, technical details not available.",
  "properties": {},
  "encodingType": "application/pdf",
  "metadata": ""
}
❓ Question #5
- Why did we only create one
ObservedPropertyand oneSensortype, but multipleThingsandLocations?- Save a screenshot of the filled in HTTP tool with your compiled JSON object/s used to create entities in the report
- Use the API to access the full set of created
ObservedPropertyand save the JSON output, attach it to the report
Create the Datastream
The Datastream is where the Thing, Sensor and ObservedProperty branches in the UML model all meet.
You’ll be wanting to create one data stream per location.
Change the API end point, populate the JSON below and post your request, take note of the following:
- Any fields enclosed in angle brackets must be filled by you.
- Think about what
@iot.idfields you give, these are meaningful as they link to other entities in the database.
{
  "name" : "<name>",
  "description" : "Parking spaces at <car park>",
  "observationType": "none",
  "unitOfMeasurement": {
    "name": "Parking Space",
    "symbol": "int",
    "definition": "int"
  },
  "Thing": {"@iot.id": <id of Thing>},
  "Sensor": {"@iot.id": <id of Sensor>},
  "ObservedProperty": {"@iot.id": <id of ObservedProperty>}
}
❓ Question \ Result #6
- Save a screenshot of the filled in HTTP tool with your compiled JSON object used to create entities in the report
- Use the API to access the full set of created Datastreams and save the JSON output, attach it to the report
Populate the Database
Till now, we’ve posted Things, Locations, ObservedProperties and
DataStreams. It is time to populate actual observations. Once again, change the
API end point and use the following payload, once again take note of the
following:
- Consider which result is going to be associated with which
Datastream - You will post as many observations as their are lines in the
CSV
{
  "result" : <reading>,
  "Datastream": {"@iot.id": <id of Datastream>},
  "phenomenonTime": "<timestamp>"
}
❓ Question \ Result #7
- Provide a summary table showing how many
Things,Observations,Locations,ObservedProperties,SensorsandDataStreamsyou created.- Save a screenshot of the filled in HTTP tool with your compiled JSON object/s used to create entities in the report
- Use the API to access the full set of created
Observationsand save the JSON output, attach it to the report.
Part C - Visualizing and Publishing Large Datasets
In the previous section, we manually inserted entities into the database. Your
sample set contained six entries, but the full dataset
parking_available_20250512T1418Z.csv contains over 129,000. We’ll now be using a
Python parser in lab7/populate.py to parse this larger CSV file and make the HTTP requests (thus, the Python script will act as a HTTP client to the FROST server). After
this, we’ll be visualizing the data online.
Browse to the map at http://localhost:8080/geoweb/lab7/index.html. You’ll notice a fairly simple and empty map.
Create a new database
Since we used our database to populate samples, we must now create a fresh database (and use that from FROST) to take the bulk data.
- Shutdown your Tomcat server.
- Create a new database, this time called
sensorthings- don’t forget to create thepostgisextension. - Modify the
context.xmlof the FROST server (step 5 of the installation process) and replace any reference ofsensorthings-samplewithsensorthings(there should be three). - Start your Tomcat server.
- Re-update the database: http://localhost:8080/FROST-Server.HTTP-2.3.1/DatabaseStatus.
Populate the server
Open the populate.py script and run it from your IDE. You may receive an error that the path to the data is not found (it depends on where you run the file from). In that case, go into populate.py and change the DATA_PATH variable to the absolute path. You should receive messages stating
the status code 200 and the entity created. This may take a few minutes.
Update index.html
In lab7/index.html add the following script in the <head> tag after the
leaflet scripts but before the style tags.
<script src="https://unpkg.com/sta-map"></script>
Now add the following lines to the script which currently calls the base map:
    L.stam({
        baseUrl:
        "http://localhost:8080/FROST-Server.HTTP-2.3.1/v1.1",
        cluster: false,
        clusterMin: 6,
        queryObject: {
            entityType: 'Things'
        },
        plot: {
            startDate: new Date(Date.now() - 1000*60*60*24*60),
            endDate: new Date()
        }
    }).addTo(mymap);
Finally, refresh the page at Browse to the map at http://localhost:8080/geoweb/lab7/index.html. You should be seeing pins representing the sensors we just added, go ahead and zoom in on them, inspect them and click on them to answer the next questions.
❓ Question \ Result #8
- What requests are being made to pull these pins, and what do the responses contain?
- You should be seeing many requests, but many of them have nearly empty responses. In your own words, why do you think that is?
- What kind of network traffic do you see when you click on the pin and then on the words
Free parking spaces? Add the relevant URLs, and explain their purpose in your report.- Attach screenshots of the working map with your report (show both the map as well as a chart of a time series).
- Make a recommendation: How you would adapt this simple example to be more general with handling the time component? How would you implement this?