geo1007-labinstructions
GEO1007 Lab 5 - Mobile App Development
This assignment consists of the following parts:
- Publishing a site using GitHub Pages
- Make an App suitable to use on a smart phone
- Use the (mobile) browser location tracking capability to request a user’s position
- Add geocoding and compare with other solution
- Allow users to share Points of Interest on the map (using WFS-T)
Set up github pages on your fork
This assignment requires you to make your work accessible on multiple devices, not just your own laptop. To do this, we will publish the modified files on GitHub using GitHub’s webserver (using ‘GitHub Pages’). GitHub pages is a basic webserver that can not run custom server-side code (like Geoserver). It can, however, serve static files (also known as static content serving).
Here are the steps you need to take:
- Synchronize your fork of the course’s git repository on GitHub.
- Update the local git repository using the
git pullcommand. If you’ve followed previous instructions, the repository should be in thewebappsdirectory under the namegeoweb. - Create a new branch for your work using the
git checkout -b <branch_name>command. You can name the branchdevelopor choose another name. - Push the new branch to your fork on GitHub using the `git push -u origin
` command. -
Set up GitHub Pages to serve this branch. You can follow the instructions at: https://docs.github.com/en/pages/getting-started-with-github-pages/configuring-a-publishing-source-for-your-github-pages-site#publishing-from-a-branch.
💡 Tip
- When you reach step 6 of the Github Pages instructions, make sure to select the branch name you just created.
- The process of publishing the website on Github is also known as ‘deploying’ the site.
- You can now navigate to your repositories page and on the right hand pane see
the new section Deployments. If the deployment process is finished (you
may need to refresh) you can click
Deploymentsand see the link to your new website.
Convert the App into a Mobile App
Familiarize yourself with the HTML, CSS and Javascript code inside the lab5 directory.
-
Test the mobile app: Visit the site you just deployed on GitHub Pages using your smartphone. The URL is
https://<username>.github.io/geo1007-2024/lab5/, where<username>is your GitHub username. The URL ishttps://<username>.github.io/geo1007-2025/lab5/, where<username>is your GitHub username.⚠️ Important
Make a screen shot on your mobile; For answering Question 1.
-
Modify the app for mobile use: We’re going to make the app more mobile-friendly and full screen. Make the following changes locally:
-
Add the following
metatag inside the<head>tag (you can read more about this tag at: https://developer.mozilla.org/en-US/docs/Web/HTML/Viewport_meta_tag):<meta name="viewport" content="width=device-width, initial-scale=1.0, maximum-scale=1.0, user-scalable=no" /> -
In
main.css, change the values ofwidthandheightfrom80vw/80vhin thebodyselector to the appropriate values for making the map-full screen.
-
-
Test your changes: Start your local Apache Tomcat server, browse to Lab 5 and check if your modifications work as expected.
-
Commit and push your changes: If you’re happy with your changes, commit them to the branch you created and push them to GitHub. See note below if you’re unsure how to do this. GitHub will then publish your updated site.
💡 Adding, Committing and Pushing to GitHub
The sequence for ‘uploading’ locally changed code to GitHub is as follows:
- Check the status of your files using the command
git status. You will see a list showing you what files have been modified; possibly another one shows you which files are untracked (i.e. new files) - If you’re happy with sending all these files to the repository, use
git add .
Here, the.means add all files in this directory. You can also specify files individually (then name them each, instead of using.). - Commit the changes with
git commit -m <your message>. Make sure to include a message (its mandatory) stating these changes were about. - Finally, upload (
push) the changes usinggit push. The files will be uploaded to the specific branch at the local repository.
If you find that the deployed site on Github needs more modifications, make them locally, push and wait for the branch to be deployed.
💡 Hint You may have to refresh / clear your cache / ‘disable cache’ (Web Developer Tools) to see the changes on the deployed page. The changes done in step 2 should be reflected in your local deployment too. - Check the status of your files using the command
❓ Question / Result #1
- What smartphone (make, model) did you use to test the app?
- In your report put 2 screenshots of the site running on your smart phone: one version before the changes were applied and a version after
Adding a Geocoder component
Now we will use an existing Javascript component and integrate it into our application to get geocoding functionality.
Under the <body> tag add (right under the script tag where leaflet is embedded):
<script src="https://unpkg.com/leaflet-control-geocoder@2.4.0/dist/Control.Geocoder.js"
    integrity="sha384-rGCFEOuLo3qUtZTJs5enHPutiikUQ6AJroPg2rQqOhmXBPmZdvhwK2aCmkhe9gwo" crossorigin=""></script>
Inside main.js add the following Javascript:
// Register a geocoder to the map app
register_geocoder = function (mapInstance) {
  let polygon = null;

  function clear() {
    if (polygon !== null) {
      mapInstance.removeLayer(polygon);
    }
  }

  var geocoder = L.Control.geocoder({
    defaultMarkGeocode: false
  })
    .on('markgeocode', function (e) {
      clear()
      var bbox = e.geocode.bbox;
      polygon = L.polygon([
        bbox.getSouthEast(),
        bbox.getNorthEast(),
        bbox.getNorthWest(),
        bbox.getSouthWest()
      ]);
      mapInstance.addLayer(polygon);
      mapInstance.fitBounds(polygon.getBounds());
      setTimeout(clear, 2500);
    })
    .addTo(mapInstance);
  return geocoder;
}

register_geocoder(map)
Refresh the page, in the top right corner you should see a query box; except it doesn’t look good. Let’s link some external CSS into the page to solve this issue.
Under the <head> tag in the index.html add:
<link rel="stylesheet" href="https://unpkg.com/leaflet-control-geocoder@2.4.0/dist/Control.Geocoder.css" integrity="sha384-gOibXC9S5JpMrpEP0ee6wCSVHjFSEuOzLLzTUmg58qM+mJ1rI8h/aY3lS9YUmo55" crossorigin="">
Check your changes locally, then commit and push to Github.
Now, answer the following question in your report.
❓ Question / Result #2
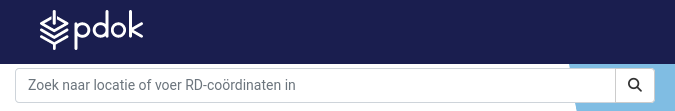
Compare results of this geocoding widget, with the one that runs on PDOK (https://app.pdok.nl/viewer/), see top left on that page:
For both geocoders make a comparision. The goal is to understand the process of geocoding and how different systems handle it. Include answers to the following subquestions:
a. What are the requests and responses made for geocoding?
b. How many requests and responses are made during geocoding?
c. What information is included in the headers and bodies of these requests and responses?
d. How are the requests and responses similar or different? For example, is there any geometry data embedded in the responses?
e. As result of which event(s) are the requests made? For example, are they made as soon as you start typing, or only after you press a button, or differently?
💡 Tip
Consider using a UML sequence diagram to illustrate the processes.
Compare and reflect upon the contents of the 2 databases used for geocoding. Try to find the positions of e.g. your home town, the municipality of “Delft”, “Piccadilly Circus”, a “hectometerpaal” along the road “A4” (or another highway in The Netherlands), coordinates: “155000 463000” (is this called geocoding?) and cadastral parcel “DEL00 A 9700”.
Ask for the user’s position
Now modify the app, so the browser will ask the user to permit access to the device its geographic position.
Add the following Javascript code in main.js (the code is based on the description found here: https://leafletjs.com/examples/mobile/).
function registerGeoLocate(mapInstance) {
  mapInstance.locate({ setView: true, maxZoom: 16 });

  function onLocationFound(e) {
    var radius = e.accuracy;

    let m = L.marker(e.latlng).addTo(map)
      .bindPopup("You are within " + radius.toFixed(1) + " meters from this point").openPopup();

    let c = L.circle(e.latlng, radius).addTo(map);

    setTimeout(function () {
      mapInstance.removeLayer(m);
      mapInstance.removeLayer(c);
    },
      25000);
  }

  mapInstance.on('locationfound', onLocationFound);

  function onLocationError(e) {
    alert(e.message);
  }

  mapInstance.on('locationerror', onLocationError);
}
registerGeoLocate(map)
Commit and push your branch and visit your app at ‘github.io’.
❓ Question / Result #3
Now answer the following questions:
- What two main functions does HTTPS provide, (hint, read: https://www.thesslstore.com/blog/how-does-https-work/?) Are both used for your site at github.io?
- Why is HTTPS required for the geolocation API to work and why does the browser ask for permission (read: https://w3c.github.io/geolocation-api/#privacy)?
- Test the accuracy of the position the app obtains in different variations: On your laptop, on your smart phone, with different browsers (Firefox, Edge, Safari), indoor, outdoor, (on your phone) with location access enabled or disabled. Add some screen shots into your report.
- Explain which position sources the Geolocation API can and (most likely) will use in which variation (use in your answer the terms: GNSS, WiFi, RSSI fingerprint, IP address).
Inserting Points of Interest
Local set-up
In this last part we are going to set up functionality for inserting data by means of a Web Feature Server Transactions (WFS-T) into a database table.
For this, perform the following steps:
-
Create database table
poisand register it into your local Geoserver instance. Obtain the SQL scriptcreate_poi_table.sqlfrom the Git repository of the course under:data/lab5/. Study the contents (understand what the script does) and load it in your database (with your preferred database client, e.g. using PGAdmin, DBeaver or psql). After loading the script, verify that the data is loaded correctly, e.g. by connecting QGIS to your database. - Now, we must register the layer inside Geoserver.
- First make a new workspace [Data -> Workspaces -> Add New Workspace] with name =
geo1007and namespace URI:http://all.kinds.of.dataand ticking theWFScheckbox, - Next, add a PostGIS store [Data -> Stores -> Add New Store], filling the connection parameters for your local database you are using
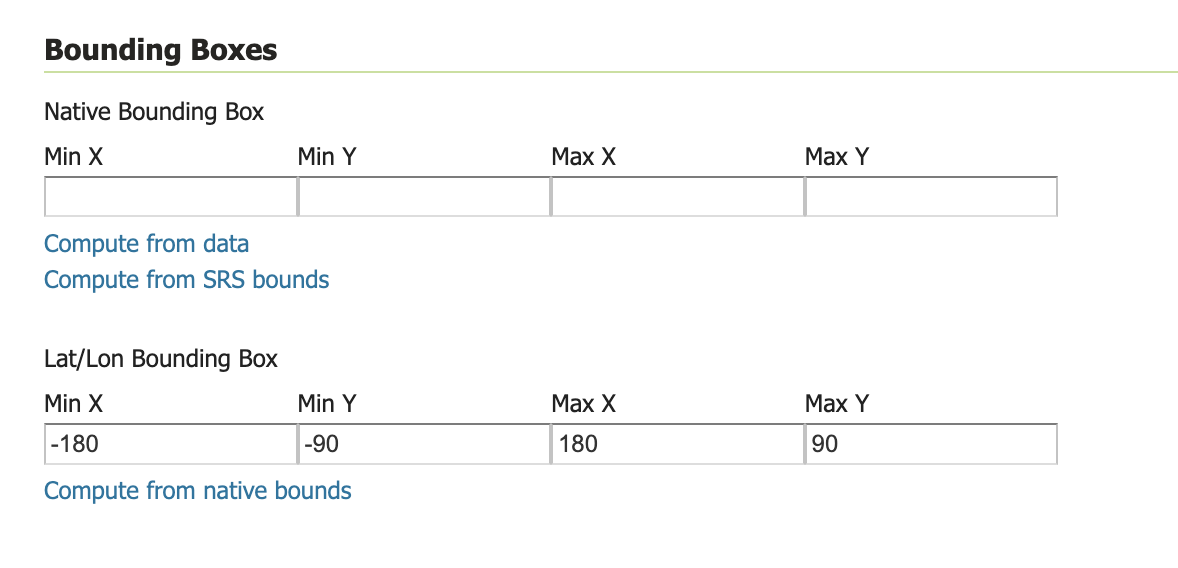
- Now, register a new WFS layer [Data -> Layers -> Add New Layer] (and populate the bounding box to the whole world).
 As ‘layer name’ again use
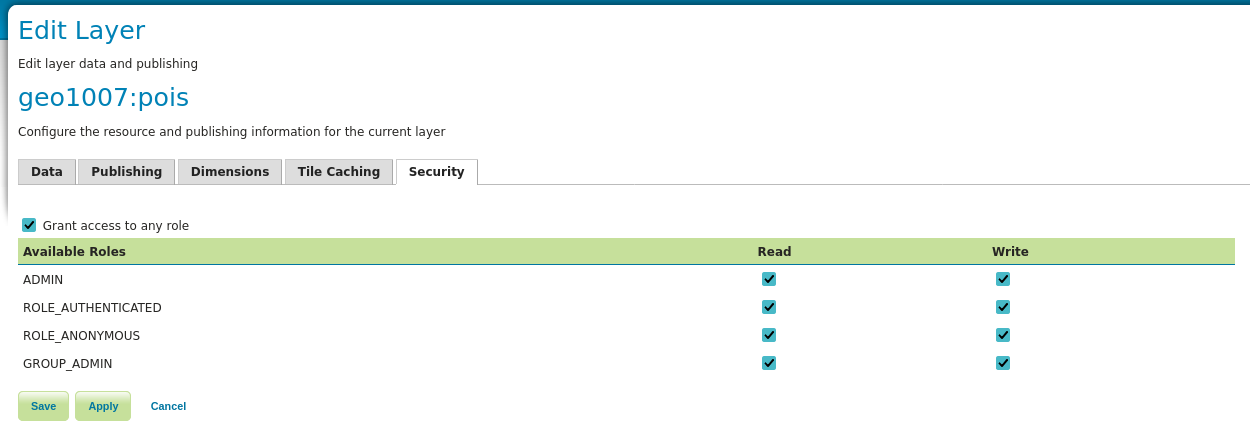
 pois.
As we, next to reading, will also allow writing to the layer using the WFS Transactions mechanism, set up under the security tab:Grant access to any roleby ticking the box (do not forget to press:Save).
 .
.💡 Tip If you use different settings, the client might not be able to insert data correctly (so, either update the Javascript, or align with these setttings in Geoserver)
- First make a new workspace [Data -> Workspaces -> Add New Workspace] with name =
-
Now add the following code into
main.js:function registerWFSReadAndWriteLayer(mapInstance, toc) { // Settings - These need to agree with the definition of the WFS layer in Geoserver var namespace_prefix = "geo1007"; var namespace_uri = "http://all.kinds.of.data"; var server_url = "http://localhost:8080" var layer_name = "pois" var geom_column_name = "geom" // End Settings // reading the layer from the WFS var url = server_url + '/geoserver/wfs?'; // These are the basic parameters for a WFS request (important: Use EPSG:4326 for Leaflet GeoJSON) var params = 'service=WFS&version=2.0.0&request=GetFeature&outputFormat=application/json&srsName=EPSG:4326&'; // Specify the WFS feature type that you request from the WFS service // In this case the geo1007:pois table: params += 'typeName=' + namespace_prefix + ':' + layer_name + '&'; // If problems with loading time: limit amount of features (for debug) //params += 'maxFeatures=400&'; params += 'count=20000&'; var styleParams = { color: 'black', fillColor: 'green', weight: 1.0, opacity: 0.6, fillOpacity: 0.4 }; // WFS layer var pois_wfs = GeojsonFromWFS(url, params, styleParams); pois_wfs.addTo(mapInstance); // Show this layer in the ToC toc.addOverlay(pois_wfs, "PoI") // Function to insert data, using WFS-T function performInsert(lng, lat, poi_name, reported_by) { var url_wfs = server_url + "/geoserver/" + namespace_prefix + "/ows?"; var featuretype = namespace_prefix + ":" + layer_name; var geomPropertyName = namespace_prefix + ":" + geom_column_name; var featProperties = [ { "name": namespace_prefix + ":poi_name", "value": poi_name }, { "name": namespace_prefix + ":reported_by", "value": reported_by } ]; var layerToUpdate = pois_wfs; insertPoint(url_wfs, featuretype, namespace_prefix, namespace_uri, featProperties, geomPropertyName, lng, lat, layerToUpdate); } return performInsert; // return function reference to be able to insert data } let insertWFS = registerWFSReadAndWriteLayer(map, toc) -
Refresh the web page. You now should see the content from your Points of Interest layer also being displayed on the map (verify the information is the same as in the database by clicking on a marker).
-
Put this javascript code in
main.js, to register the event listener, when a user clicks on the map.function registerPopUpForInsert(mapInstance) { var popup = L.popup(); function onMapClick(e) { var lng = e.latlng.lng; var lat = e.latlng.lat; var js_function = '' + ' var poi_name = document.getElementById(\'poi_name\').value ; ' + ' var reported_by = document.getElementById(\'reported_by\').value ; ' + ' insertWFS(' + lng + ',' + lat + ', poi_name, reported_by) ; '; var popupContent = '' + '<label for="poi_name">Point of Interest: </label><br>' + '<input type="text" id="poi_name" name="poi_name" value=""><br>' + '<label for="reported_by" >Reported by: </label><br>' + '<input type="text" id="reported_by" name="reported_by" value=""><br>' + '<button type="button" onclick="' + js_function + '">Insert point</button>'; popup .setLatLng(e.latlng) .setContent(popupContent) .openOn(mapInstance); } mapInstance.on('click', onMapClick); } registerPopUpForInsert(map)
Test by refreshing the page. Commit your result.
Use of remote WFS-T server
Now we will change the settings from your local WFS layer to a remote WFS layer. Update the lines that refer to your local WFS server install at: http://localhost:8080, so that you can use the remote WFS server.
Inside the Javascript code, search for these variables, and make sure they are set up as follows:
var namespace_prefix = "geo1007";
var namespace_uri = "http://all.kinds.of.data";
var server_url = "https://varioscale.bk.tudelft.nl"
var layer_name = "pois"
var geom_column_name = "geom"
Store your modifications and publish the site on ‘github.io’ (commit and push).
❓ Question / Result #4
Provide a concise explanation of the WFS-T operation used, specifically highlighting the network requests that are exchanged (you can get the request and response by using the Web Developer tools).
Now test the mobile app you developed from both a technical and a functional point of view. Tell us your test results: What does (not) work well and what would you improve? Hints to think about: Interoperability (how well does the app work on different devices), availability of network connection, how is data for the points of interest fetched after a new insert, how well are updates to the PoIs visible in real time to others, etc.
Note, if you encountered problems when developing the app, add a remark about the issue in your report.
Appendix - Remote debugging a Web App on your Smart phone
If you do a lot of mobile web apps development, it is useful to be able to use the web developer tools on your laptop, while being connected to the browser that is running on the smart phone, and where the user can perform interaction.
You can find more information in the following videos about this feature on Youtube:
- https://youtu.be/nYoH5B2GXXY (Firefox on Android)
- https://youtu.be/BpppmxgCt8M (Chrome on Android)
- https://youtu.be/4gnxf9LFpC0 (Safari on iOS)
Submit
Submit Lab 5 together with the result of Lab 6.
For this Lab 5, you submit (on Brightspace):
- Answers to the 4 questions and asked for results, in a concise report (max: 6 pages, excluding images and screenshots).
- Link to your Github repository fork and the URL where we can reach your deployed site (with the modifications applied).