geo1007-labinstructions
GEO1007 Lab 4 - WMS layers in a Leaflet web map client & QGIS
Introduction
This lab assignment builds directly on the GeoServer setup from Lab 3 and extends it in two directions: adding cartographic styling to your WMS layers using SLD (Styled Layer Descriptor), and then consuming those layers in two very different client applications — a JavaScript-based Leaflet web map running in the browser, and QGIS as a desktop GIS client.
The lab has three parts:
- Part A — ‘Server side’ (with GeoServer): add style to WMS layers using SLD
- Part B — ‘Client side’: use a Leaflet (JavaScript) web map client that supports WMS (and the Dutch coordinate reference system Rijksdriehoekstelsel)
- Part C — Use your layers inside another client (QGIS)
Assignment Design
This lab combines server-side configuration, client-side development, and cross-client interoperability testing. As in the earlier labs, there are two kinds of questions:
Questions marked as Reflective do not need to be answered in the final report. You are expected to do the work and think through them, but you can do that in the way that best supports your learning: taking notes, discussing with peers, sketching diagrams, or using external sources to help you reason through what you observe.
Questions marked as Summative do need to be present in your final report. These are broader questions where we expect you to connect the practical work to the underlying ideas of styled geospatial services and client interoperability.
The concrete outputs you create along the way are collected under Proof of Completition items.
Part A: Adding style to WMS layers (in GeoServer)
1. Preparation
a. Data files
Sync your fork on Github and pull the git repository to your laptop. The git
repo contains top10delft.zip (inside the directory data/lab4).
Unzip it so that you get a directory top10delft, and place top10delft
in the data/data directory of your GeoServer installation, so you will
have:
geo1007/apache-tomcat-<version>/webapps/geoserver/data/data/top10delft/
with the following shapefiles in it:
GEBOUW_VLAK(= building polygons)SPOORBAANDEEL_LIJN(= railroad polylines)TERREIN_VLAK(= terrain polygons)WATERDEEL_VLAK(= water polygons)WEGDEEL_VLAK(= road polygons)
b. Style files
The (updated) git repo (again in: data/lab4) also contains sld_top10.zip.
Unzip and copy the folder sld_top10 to the data/styles directory in your
GeoServer installation, so you will have:
geo1007/apache-tomcat-<version>/webapps/geoserver/data/styles/sld_top10/
with the following SLD files in it:
gebouw_vlak.sldterrein_vlak.sldwegdeel_vlak.sldwaterdeel_vlak.sld
Note: there is currently no SLD file for the spoorbaandeel_lijn shapefile.
2. Add the top10nl layers in GeoServer
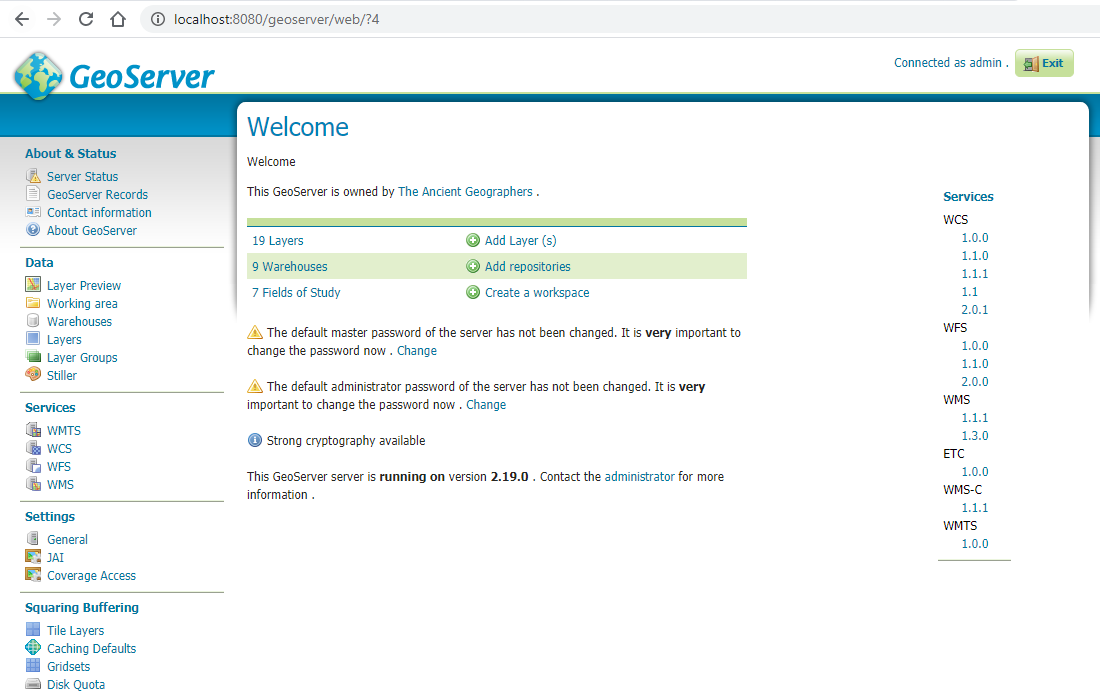
Start Apache Tomcat, and open GeoServer in your browser.
-
Add a store:
Add the whole
top10delftdirectory containing the shapefiles as one ‘store’.As workspace name you can choose the one that you already created in the Lab 3 assignment, when you defined the
parcelslayer (this is okay, because you can have the same workspace name for several different data stores and layers).💡 Note
The new data is not being served from a database as in Lab 3. This time, select the
Directory of spatial files (shapefiles)option when adding the store. -
Add layers:
Then define layers in GeoServer for 2 of the 5 shapefiles (the choice is up to you).
Note: the
top10nlshapefiles are in the Dutch coordinate reference system. So use the same EPSG:28992 code as in the case of the PostGISparcelslayer you added for Lab 3.Test in the Layer Preview (try a few options) to see the result.
💡 Note
Don’t forget to set the bounding box as in Lab 3 via
Compute from native bounds.
3. Adding style to a layer with SLD (Styled Layer Descriptor)
The next step is to add style to the 2 layers you defined, with the cartographic goal of creating a nicer looking digital map.
In this step you use the top10nl SLD files that you copied to the
data/styles directory.
3.1 Use ‘add new style’ in GeoServer (in the data section). You have to give the style a name (free to choose, but use one that you can recognize later).
Then use ‘browse’ and ‘upload’ to link the appropriate top10nl SLD file to
that new named style. You’ll see the XML load up in the Style Editor.
Then ‘validate’ the style (and look at possible warnings or errors, and correct them) and when there are no errors, ‘submit’ the style.
Note: because there is no SLD file for the spoorbaandeel_lijn layer, look in
the ‘styles’ list for a style for line geometries, and apply that to the
spoorbaandeel_lijn layer (in step 3.2).
3.2 After you have added the 2 styles to GeoServer, the next step is to apply each style to the corresponding top10nl layer. Do this via the ‘layers’ menu: open the layer so that you are in the Edit Layer page for that layer, then choose the second tab: ‘Publishing’ (see figure below).
Under ‘WMS settings’ you can make your new style the default style for that layer.
Test the top10nl layers again to see the effect of the styles. You can test in Layer Preview (and later in Part B of this assignment in a real web map client).
Proof of Completition
A. After adding both styles and applying them to your two top10nl layers, test the result in Layer Preview and make a screenshot showing the styled layers. Include this screenshot in your report.
🤨 Reflective Question
1a. Why is an SLD style definition often layer-specific? In other words, why can an SLD file generally not be applied to just any layer?
4. Create a style for the ‘parcels’ layer
Instead of using an already existing SLD file (as under step 3 above), you now
make an SLD file yourself for the parcels layer, from scratch. It can be a
simple style (all parcels the same color for the polygon and/or the boundary
line), or a style that uses different colors based on the values of one of the
properties (= attributes) of the parcels feature.
Apply your new style to your parcels layer.
Proof of Completition
B. Test the newly styled
parcelslayer in the Layer Preview and:
- Save the PNG or JPEG of the WMS output and include it in your report
- Include the SLD file you made for
parcelsin your submission
Part B: A Leaflet map client
Goal of this part of the assignment is to make a ‘map mashup’ using the output of WMS servers.
You will use a JavaScript (Leaflet) basic client that is available on the git
repository of the course (lab4). It is based on this code:
https://arbakker.github.io/pdok-js-map-examples/
We re-structured it a bit and added some other layers.
After having correctly updated your git repository earlier in this assignment,
you should have under webapps a directory for lab4:
geo1007/apache-tomcat-<version>/webapps/lab4/lib/*.js
geo1007/apache-tomcat-<version>/webapps/lab4/index.html
geo1007/apache-tomcat-<version>/webapps/lab4/main.js
geo1007/apache-tomcat-<version>/webapps/lab4/main.css
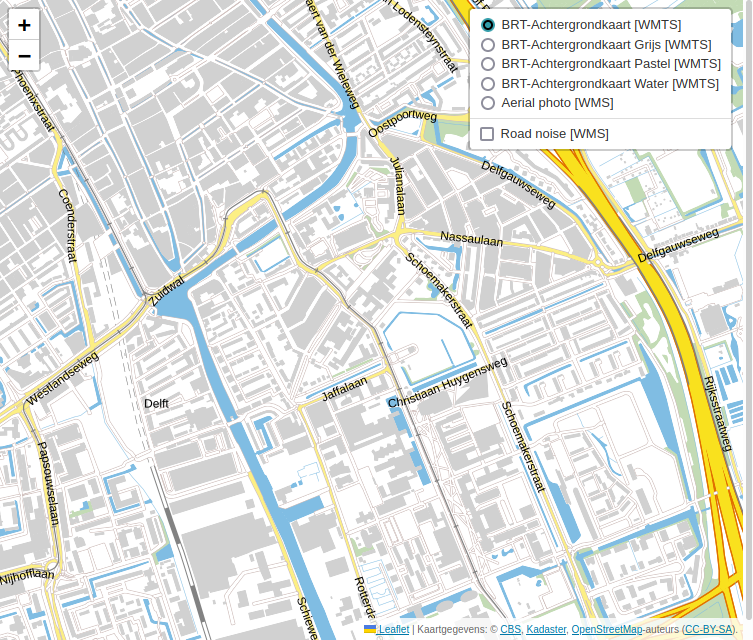
This directory contains the client. Start Apache Tomcat and navigate in your browser to http://localhost:8080/geoweb/lab4. You should see a map of the Netherlands, zoomed in to Delft. In the right hand corner there is an icon that gives the layers that are loaded at the moment:
For the following parts of the assignment you have to edit the main.js file
(in a text editor of your choice).
Add a WMS layer
Include a WMS request for the parcels layer you created during Lab 3, so
that you will have an extra map layer.
💡 Hint
Inspect the file
main.js. How is this done for thegeluidskaartenWMS service (English: road noise / sound)?
💡 Hint
Don’t forget to specify the new layer in the list in the
overlaysvariable for the layer control, so you can switch it on and off.
Proof of Completition
C. Make a screenshot of the
parcelslayer added to the Leaflet map and include it in your report.If you do not succeed, describe what goes wrong, what you tried to make it work, and why you think it is not working.
Also add the top10nl layers you created earlier
You can do this as a group of layers, in one variable, like this:
layers: ['layer1', 'layer2']
(Replace layer1 etc. with the real layer name.)
Experiment with the styles for a layer
The style per WMS layer in the geoclient examples is the default style for that layer.
To get another style for a layer than the default one, you have to specify the name of that style, like this:
styles: ['style1', 'style2']
(Replace style1 etc. with the real style name.)
💡 Note
As a user of a WMS service, you can query the names of the available layer styles by performing a
GetCapabilitiesrequest, like so: http://localhost:8080/geoserver/ows?service=WMS&request=GetCapabilities
Add a WMS layer of PDOK (national georegister)
Now add another layer to the Leaflet client, this time not from your own server (localhost), but a layer from a WMS service offered via the national geoportal, PDOK: https://www.pdok.nl/datasets
Note, if you do not speak Dutch, Google Translate works fairly well on this page (but searching still requires Dutch search terms): https://translate.google.com/translate?sl=nl&tl=en&u=https%3A%2F%2Fwww.pdok.nl%2Fdatasets
Choose one WMS service from the list at PDOK, and find out which layers are
offered by that service. Then add that layer to your Leaflet client by editing
main.js.
Test whether the new layer is indeed displayed in the Leaflet client.
🤨 Reflective Question
2a. Which mechanism does the PDOK service expose for discovering what layers it offers and how they can be requested? What information can you extract from it, and how does this compare to what you already encountered in Lab 3?
Proof of Completition
D. Include in your report:
- The JavaScript fragment that you added to
main.jsto load the PDOK layer- A screenshot of the resulting map with the PDOK layer visible
Fix the aerial image background layer
As you have seen, the second background layer with aerial images (‘luchtfotos’ / LUFO) does not work anymore. Find out the new URL for the ‘luchtfoto’ and fix the geoclient so that again there is a background layer of aerial images.
Proof of Completition
E. Include in your report the corrected URL or the code fragment you changed to restore the aerial image background layer.
Part C: Using the layers in another client (QGIS)
In this part of the assignment, we are concerned with the ‘interoperability’ aspect. Next to your web client, you will use QGIS to consume the data services you have created so far.
Load the same layers that the web client from Part B shows, inside QGIS.
Proof of Completition
F. Include a screenshot of the QGIS user interface with all the layers loaded.
🤨 Reflective Questions
3a. When connecting to the WMS and WFS layers in QGIS, which Coordinate Reference System(s) does QGIS offer or apply? Do the layers appear where you expect them, and does QGIS handle the CRS the same way as the Leaflet client did?
3b. Is it possible to query feature information from the
parcelsWMS layer in QGIS? What happens when you try, and how does the result compare to the OpenLayers preview you used in Lab 3?
📝 Summative Question 1 — Reading your own SLD
Expectations: Between 1 and 2 pages of text, images optional but encouraged. Less is more!
Question: Take the SLD file you created for the
parcelslayer and use it as your primary example. Walk through the key elements of that file and explain how each part connects the data properties of the layer to what appears in the WMS output. Where in the SLD do you see the link to specific attribute values or geometry types, and how does that manifest in the map image you included in Proof of Completition B? Also reflect on the difference between applying a ready-made SLD (as in step 3) versus writing one yourself: what did that difference reveal about how style definitions actually work?Grading (5 points): Lower-range answers typically identify basic elements of the SLD and connect them loosely to the map output. Mid-range answers usually explain more concretely how specific rules or property filters in the SLD produce the visual result seen in the Layer Preview. Strong answers tend to trace the link between a specific attribute or geometry type in the data, the corresponding rule in the SLD, and the map image produced, and reflect on what was revealed by writing the style from scratch. The strongest answers use the SLD file and the Layer Preview output together as evidence, and explain clearly and accurately how styling works in the WMS model.
📝 Summative Question 2 — One layer, three clients
Expectations: Between 1 and 2 pages of text, images optional but encouraged. Less is more!
Question: The
parcelslayer you published as a WMS in Lab 3 was now consumed by three different clients: the GeoServer Layer Preview (Lab 3), the Leaflet web client (Part B), and QGIS (Part C). Using specific observations from at least two of those three experiences, discuss what stayed the same and what changed as the same service was used in different contexts. Pay attention to things like how the layer was requested, how the CRS was handled, what styling appeared, and whether feature querying worked. What does this tell you about what OGC standards actually guarantee — and where did you notice limitations or unexpected behavior?Grading (5 points): Lower-range answers typically note that the same layer appeared in more than one application without examining what that required. Mid-range answers usually compare at least two client experiences and identify something concrete that was consistent or different across them. Strong answers tend to connect those observations to what OGC standards do and do not specify, and reflect on at least one moment where things did not work as smoothly as expected. The strongest answers use specific evidence from the student’s own requests, screenshots, or configuration to build a well-reasoned account of what interoperability means in practice in this lab.
Submit
Your report and output files should be in a zipfile containing:
- A report with:
- Proof of Completition A
- Proof of Completition B
- Proof of Completition C
- Proof of Completition D
- Proof of Completition E
- Proof of Completition F
- Summative Question 1
- Summative Question 2
- Your names in the report, to prevent mix-up
- The SLD file for the
parcelslayer (for Proof of Completition B) - The complete
lab4directory with the changedmain.js(but also the unchanged files)
Submit the zipfile (together with your results for Lab 3) via Brightspace.